
Performance
Economic Environment
The first half of 2012 was marked by the uncertainties brought about by the world economy as a result of the European crisis. Concerns about a breakup of the bloc affected the world's economic performance throughout the year and remains one of the main risk factors in 2013. The sluggish rebound in the U.S. and the slowdown in China also contributed to the deterioration of the economic agents' estimates.
The Brazilian economy, as well as all other emerging economies, was affected by this
Nevertheless, it was not a lost year. The labor market remains one of the pillars of the Brazilian economy and helps maintain household spending. According to IBGE (Instituto Brasileiro de Geografia e Estatística, or Brazilian Institute of Geography and Statistics), the unemployment rate stood at 4.6% at the close of 2012 – the lowest in the historical series–, with an average rate of 5.5% in the year. The average income of the working population rose by 4.1% versus a 2.7% rise in 2011.
The credit granted to the private sector totaled R$ 2.2 billion in 2012, 15% higher than in the previous year, which accounted for 95% of the total balance of credit supplied by the financial system. Loans to the segment of other services rose 3.7%, with special mention to the industries of power, telecom and transportation.
Even within an adverse economic environment, Brazil registered 342 million telecom (fixed and mobile telephony, accesses at the close of 2012, according to data released by the Brazilian Telecommunications Association (Telebrasil), representing a 9.7% growth year-over-year. The highest increase in demand was registered in the pay- TV segment, which reported 16.2 million accesses, up 27% from 2011, followed by broadband services, mobile and fixed telephony, which posted increases of 10%, 8% and 2% respectively.
The segment of mobile phone services, which accounts for 76,5% of the overall number of accesses in the industry, recorded a number of over 261.7 million lines in service at the close of 2012, of which 80.5% consists of pre-paid phone services and 19,5% of post-paid. A total number of 19.5 million mobile lines were enabled in 2012, representing an 8% increase over the previous year. Brazil's teledensity stood at 132.78 lines per 100 inhabitants in 2012, up 7.19% from 2011. As for the 3G lines, with access to mobile broadband, accounted for 22.6% of the base, representing 59.2 million accesses during the year.
Economic and Financial Performance
Revenue Generating Units - RGUs (thousand)
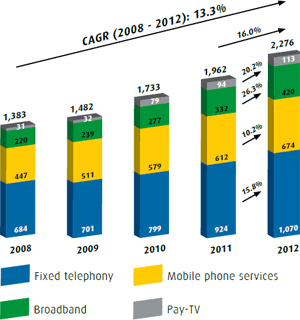
Telecom
At the close of 2012, Algar Telecom had 2.3 million Revenue Generating Units (RGU) in its Telecom segment, representing a 16.0% increase year-over-year.
Fixed telephony
The Company closed 2012 with a number of 1,070,000 fixed lines. The 15.8% growth in relation to the previous year was driven by the performance achieved in both areas of authorization and concession. In concession area, where the Company's business is mainly concentrated in the retail segment, the number of fixed lines climbed from 693,000 to 760,000, reflecting the positive response to offering of packages combining fixed-line phone, broadband and pay-TV services. In the authorization area, where the Company provides services to the corporate segment, the number of fixed lines grew by 33.9%, from 231,000 to 310,000, which reflects the uptrend for the number of clients located in the cities surrounding the Company's backbone.
Broadband
Broadband connections reached 420,000, representing a 26.3% growth year-overyear, which evidences the clients' credibility in the Company's focus on quality. A contributing factor to this performance was the increase in the Ultra Broadband internet access plan, of up to 100 Mbps, through HFC (hybrid fiber-coaxial) cable and GPON networks. In the segment of 3G technology, an important addition to the range of products and services, the number of clients grew from 56,000 in 2011 to 93,000 in 2012, representing a year-over-year growth of 65.0%.
Mobile Phone Services
In this segment, the client base in 2012 climbed by 10.2% year-over-year, to a total of 674,000 clients. The post-paid segment showed a 2.7% increase, from 205,000 clients in 2011 to 211,000 in 2012. The pre-paid segment, in turn, presented a 13.9% growth year-over-year and totaled 463,000 clients. At the end of 2012, 31% of Algar Telecom's mobile phone clients had post-paid plans, with an ARPU (Average Revenue per User) of R$ 32.40.
Pay-TV
The number of clients for this service totaled 113,000 at the close of 2012, representing a 20.2% increase in relation to 2011. In December 2012, the Company provided access to 44 HDTV resolution channels, for both cable and satel lite TV plans.
Consolidated gross revenues
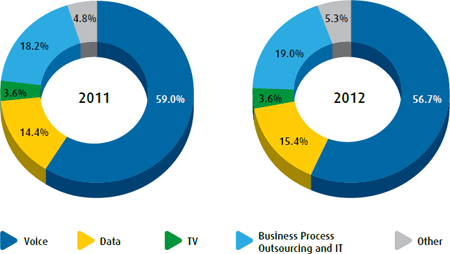
At the close of FY 2012, consolidated gross revenues came to R$ 2,338.7 million, up 8.4% from 2011, mainly driven by the broadband services (35.4%), telecom engineering (29.1%), voice and data services for the corporate market in the authorization area (18.2%), and Business Process Outsourcing and IT (13.1%). The revenue profile evolved in line with the Company's strategic plan. At the close of 2012, only 39% of the overall revenues came from voice services, 33% from data and broadband services,19% from Business Process Outsourcing and IT, 4% from pay-TV, and 5% from ot her services.
Telecom
Revenues from telecom services, which accounted for 76% of the Company's overall revenues in 2012, amounted to R$ 1,770.4 million, up 6,7% from 2011. This increase mainly resulted from higher revenues from voice and data solutions to the corporate market in the authorization area, broadband services and mobile telephony, which more than offset the drop in revenues from fixed-line local traffic, long-distance calls and fixed telephony cards.
Business Process Outsourcing and IT
Consolidated gross revenues from the segment of Business Process Outsourcing and IT (19% of total revenues) came to R$ 444.2 million in 2012, up 13.1% from 2011, when revenues of R$ 392.7 million were recorded. This rise was due to 9.5% higher revenues from process outsourcing services, and 34.8% higher IT revenues. At the close of 2012, IT services accounted for 21.0% of total revenues from this segment.
Complementary Businesses
At the close of 2012, consolidated gross revenues from Algar Telecom's complementary businesses totaled R$ 124.1 million, versus R$ 104.5 million in 2011, climbing by 18.8%. Of particular reference was the telecommunications engineering business, which reported a 29.1% growth. Revenues from phone directories and guides, in turn, rose by 3.7%.
Net operating revenues
In 2012, Algar Telecom's net operating revenues stood at R$ 1,811.5 million, up 7.7% from 2011, due to the factors previously described.
Operating costs and expenses
R$ million
| CONSOLIDATED FINANCIAL SUMMARY | 2011 | 2012 | % var. |
|---|---|---|---|
| OPERATING COSTS AND EXPENSES | (1,271.1) | (1,359.0) | 6.9% |
| Personnel | (544.9) | (572.8) | 5.1% |
| Materials | (43.7) | (45.5) | 4.0% |
| Third-party services | (286.9) | (347.2) | 21.0% |
| Interconnection | (210.1) | (176.6) | -15.9% |
| EILD Connection Means | (39.6) | (44.7) | 12.7% |
| Marketing and Advertising | (29.7) | (29.9) | 0.5% |
| ADA | (16.7) | (25.9) | 55.0% |
| Others* | (99.3) | (116.4) | 17.2% |
* Including other operating revenues (expenses).
Operating costs and expenses (excluding depreciation and amortization) amounted to R$ 1,359.0 million in 2012. The 6.9% rise year-over-year resulted mainly from:
- Personnel costs and expenses (up R$ 27.8 million): (i) personnel costs in the telecom engineering segment climbed by R$ 20.2 million, due to both the expansion of the scope of services regarding existing contracts, coupled with the addition of new clients; (ii) R$ 7.6 million higher personnel expenses, in the three business segments, owing to the wage adjustment as a result of the collective wage agreement, partly offset by the reduction in headcount, due to the termination of some contracts and the termination of some contracts, and the payroll tax reduction (Plano Brasil Maior);
- Third-party service costs and expenses (up R$ 60.3 million): (i) R$ 19.9 million higher costs in programming and transmission maintenance of satellite TV; (ii) R$ 18.0 million higher costs in the expansion of Business Process Outsourcing and IT (including software maintenance, training and advisory services); (iii) R$ 11.2 million higher costs in back office and consulting services; and (iv) R$ 5.3 million higher costs in network construction and maintenance, training and others;
- Interconnection costs (down R$ 33.5 million): (i) reduction in the VU-M tariff (ANATEL Resolution No. 576); and (ii) reduction in the fixed-line to fixed-line connection tariff, resulting from promotional campaigns to stimulate intranetwork and local calls;
- EILD costs (up R$ 5.0 million): higher expenses on third-party network fees to serve clients located outside the Company's original area;
- "Other" costs and expenses (up R$ 17.1 million): (i) R$ 11.4 million higher costs in infrastructure leasing, easement and real estate in the telecom segment; and (ii) R$ 1.7 million higher costs, due to a contract discontinuation in the Business Process Outsourcing and IT segment, as well as related to the real estate leasing contract in the telecommunications engineering business segment. In addition to the aforementioned increase in costs, the "other operating revenues" declined by R$ 2.1 million.
EBITDA
R$ million
| EBITDA and EBITDA Margin | 2011 | 2012 | % var. |
|---|---|---|---|
| Telecom | 361.8 | 376.3 | 4.0% |
margin |
29% | 29% | - |
| Business Process Outsourcing and IT | 36.1 | 58.9 | 63.4% |
margin |
9% | 13% | - |
| Complementary businesses | 13.1 | 16.2 | 23.4% |
margin |
8% | 8% | - |
| CONSOLIDATED EBITDA | 411.1 | 452.3 | 10.0% |
margin |
24% | 25% | - |
The EBITDA of the Telecom segment amounted to R$ 376.3 million in 2012, up 4.0% from 2011. The EBITDA margin, in turn, remained virtually flat, at 29%.
The Business Process Outsourcing and IT segment reported EBITDA of R$ 58.9 million in 2012, up 63.4% from 2011, with an EBITDA margin of 13%, versus 9% in 2011. This increase primarily derives from the improved operational performance, stemming from efficiency and quality projects, in addition to the "Plano Brasil Maior", which incurred a payroll tax reduction for the contact center services.
Complementary businesses recorded a R$ 16.2 million EBITDA in 2012, up 23.4% from 2011, with an EBITDA margin of 8%, flat in relation to the previous year.
As a result of the above-mentioned events, Algar Telecom's consolidated EBITDA came to R$ 452.3 million in 2012, up 10.0% from 2011. The consolidated margin was 25%, representing a 0,6 p.p. increase over 2011.
Net financial result
Algar Telecom's net financial expenses amounted to R$ 82.4 million in 2012, down 5.8% from 2011, mainly due to the drop in CDI's average rates.
Net income
The Company recorded consolidated net income of R$ 141.0 million in FY 2012, versus R$ 144.4 million in 2011. Net margin stood at 7.8%, versus 8.6% in the previous year. nevertheless, it is worth pointing out that in 2011, the Company's net income had a positive impact from a non-recurring effect in the amount of R$ 17.1 million, related to deferred tax credits. If this extraordinary effect over the 2011 earnings is disregarded, the net income in 2011 results in R$ 127.3 million, and consequently the 2012 net income would show a 10.8% increase year-over-year, with a 0.2 p.p. rise in net margin.
Debt
Gross debt amortization schedule
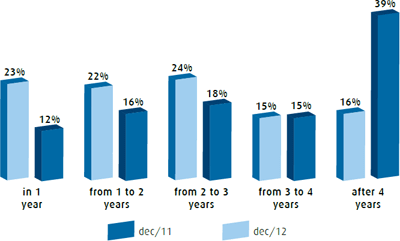
At the close of 2012, Algar Telecom's gross debt stood at R$ 925.5 million (R$ 814.8 million in 2011). Net debt, in turn, totaled R$ 738.7 million, versus R$ 636.5 million in the previous year. The R$ 102.2 million increase in net debt results from the additional fund-raising required to cover part of the investments carried out during the period, in he amount of R$ 350.8 million.
In 2012, the Company completed its second successful public placement of non-convertible debentures. This issue, effected in November 2012, resulted in proceeds that totaled R$ 293.9 million, divided in two series. The first one enjoys a 5-year maturity, with a CDI + 1.40% p.a. remuneration, and the second trench features a 7-year maturity, remunerated at IPCA + 6.00% p.a. The funds raised were partly used for the redemption of the debentures from the first issue, as well as to reinforce the amount of liquid assets. Hence, there was a significant improvement in Algar Telecom's debt profile, with more extended maturities ov er the next years.
Furthermore, the Company managed to maintain a suitable financial leverage, measured by the Net Debt/EBITDA ratio, which stood at 1.6x in 2012, versus 1.5x in 2011.
Investments - CAPEX
Total investments in 2012: R$ 350.8 million
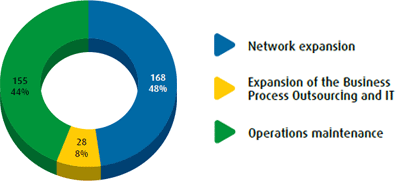
In 2012, investments totaled R$ 350.8 million. The funds were allocated to reinforce the Company's structure intended to support the growth of its operations, as well as to reinforce the Company's competitive position over the ensuing years. From the total volume of investments, 48% was allocated to the network expansion, with a consequent growth in data, voice and TV services. 8% was allocated to the growth in the Business Process Outsourcing and IT, and 44% was directed to support the maintenance services and the quality of operations.
DVA
Distribution of value added in 2012: R$ 1.4 billion
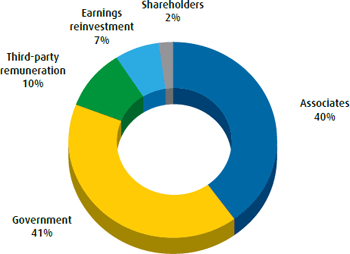
The Value Added Statement shows the breakdown of the total direct economic value generated and distributed by the Company, which includes revenues, operating costs, remuneration to employees, donations and other investments in the communities, retained earnings and disbursements related to funding sources and the government. In 2010, 2011 and 2012, the Company generated R$ 1,224 million, R$ 1,402 million and R$ 1,437 million respectively. The largest portion of those amounts was distributed to associates and the government. The amount distributed to shareholders remained virtually stable over the last three years.
The retained amount, which represented 7% of the total distribution in 2012, shall be allocated to new investments and to the maintenance of operations in 2013, aimed at providing quality products and services to the clients.
VALUE ADDED STATEMENT
R$ million
| 2010 | 2011 | 2012 | |
|---|---|---|---|
| Revenues | 1,960 | 2,183 | 2,336 |
| Revenues from sales | 1,960 | 2,183 | 2,336 |
| Inputs acquired from third-parties | (621) | (667) | (763) |
| Cost of goods sold and services rendered | (418) | (403) | (489) |
| Materials, power, outsourced services and others | (204) | (264) | (274) |
| Provision for losses / asset devaluation | - | - | - |
| Gross value added (1-2) | 1,339 | 1,515 | 1,573 |
| Depreciation and amortization | (150) | (145) | (162) |
| Net value added (3-4) | 1,189 | 1,371 | 1,412 |
| Financial Income | 35 | 31 | 25 |
| Total value added to be distributed (5+6) | 1,224 | 1,402 | 1,437 |
| Value added breakdown | 1,224 | 1,402 | 1,437 |
| Personnel | 394 | 484 | 573 |
| Taxes and contributions | 548 | 594 | 584 |
| Third-party capital remuneration | 151 | 179 | 139 |
| Interests | 103 | 119 | 73 |
| Leases | 49 | 60 | 66 |
| Dividends and Interest on equity | 31 | 35 | 34 |
| Retained earnings for the period | 100 | 109 | 107 |