Economic and Financial Performance
GRI G4 EC1 – Material issue: Aspect: Economic Performance
GROWING WHILE
CREATING VALUE
Higher revenues coupled with
improved operational efficiency
Economic Situation
The economic environment was consistently challenging throughout 2014. Two major events captured everyone’s attention–the FIFA World Cup and the presidential election, and Brazil fell into a technical recession. Another concern was the increase in public spending.
In addition, the Brazilian economy is plagued by inflationary pressure. Inflation as measured by IPCA [Broad Consumer Price Index] remained high and stood at 6.41%, slightly below the Central Bank’s target ceiling, at the close of 2014. In an attempt to check inflation, which breached the target ceiling during the year, the government increased by 1.75 p.p. the benchmark interest rate, which stood at 11.75% at the close of 2014.
However, the average unemployment rate remained low and closed the year at 6.8%, a drop in relation to 2013.
A fiscal adjustment, cuts in public spending, a rise in taxes and adjustments in government-controlled prices are all expected for 2015.
Telecom Operating Performance
Telecom
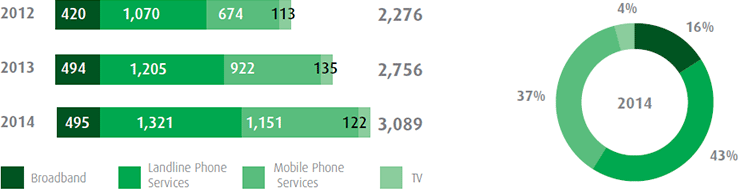
In 2014, the Telecom Revenue Generating Units (RGU) recorded total revenue of about R$3.1 million, up from R$2.8 million in 2013, a 12.1% rise. All services, except TV, reported a revenue growth. It is worth noting the 24.9% rise in the mobile phone services segment.
Performance of Revenue Generating Units
(in thousands)
Financial Performance
In 2013, we made some adjustments in our financial information disclosure policy because of some corporate processes. Previously, we presented revenue and EBITDA separately for three different business segments: Telecom, Business Process Technology and Complementary Businesses. Due
to corporate changes, the amounts comprising Complementary Businesses are now reported as part of the two other segments, as follows: revenue from phone directories and guides are now part of Telecom revenue. In turn, revenue from telecommunications engineering–connected with Engeset–are now part of revenue from Integrated ICT Solutions and BPO (previously known as Business Process Technology).
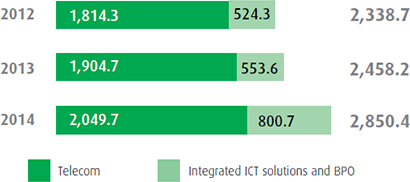
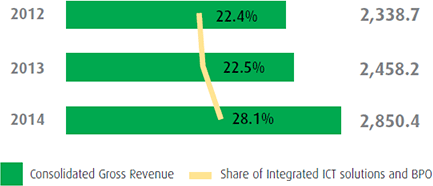
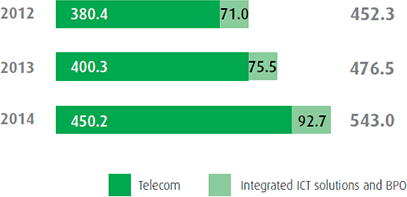
Consolidated Gross Revenues
Consolidated gross revenue increased by 16.0% year-over-year, to R$2,850.4 million, in 2014. Telecom accounted
for 72% (vs. 77% in 2013) whereas Integrated ICT Solutions and BPO accounted from 28% of that revenue (up from 23% in 2013). Part of the growth in this business segment was driven by the Asyst acquisition, in January 2014.
Gross Revenue
(in R$ million)
Consolidated Gross Revenue vs. Share of the
Integrated ICT Solutions and BPO Business
(in R$ million and %)
Telecom
Revenues from the Telecom business amounted to R$2,049.7 million, up 7.6% from R$1,904.7 million recorded in 2013. The main highlights were the 14.4% (R$75.8 million) increase in revenue from corporate clients in our area of expansion–not considering a non-recurring event, 28.0% in mobile voice revenues (R$66.1 million) and 20.2%
(R$23.3 million) in TV revenue, which more than offset the fall in landline voice and network use revenues.
Integrated ICT solutions and BPO
In 2014, revenue from ICT integrated solutions and BPO was driven by both the Asyst acquisition and the number of new clients. Consequently, it shot up by 44.6% to R$800.7 million.
Consolidated Net Revenue
(in R$ million)
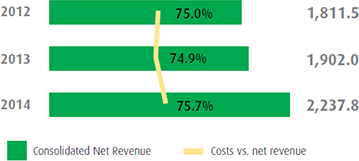
Net Operating Revenue
Consolidated net revenue totaled
R$2,237.8 million in 2014, up 17.7% from R$1,902.0 million in 2013.
Operating Costs and Expenses
Operating costs and expenses, excluding depreciation and amortization, amounted to R$1,694.8 million in 2014. In absolute amounts, they climbed by 18.9% rise year-over-year. This rise, mainly led by expenses on personnel and third-party services in the Integrated ICT Solutions and BPO segment, was partly offset by a fall in interconnection costs and allowance for doubtful accounts
in the Telecom segment. In relative terms, operating expenses and costs corresponded to 75.7% of net revenue in 2014, stable in relation to 74.9% in 2013.
Allowance for Doubtful Accounts
The ADA expense fell by 17.3% to R$28.1 million in 2014, vs. R$33.9 million in 2013. The ADA/gross revenue ratio stood at 1.0%, against 1.4% in 2013. This performance resulted from our efficiency initiatives, intended to provide a better understanding of each of our clients, coupled with strict credit management and collection policies.
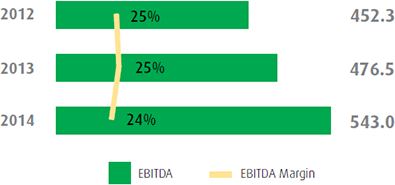
EBITDA
Consolidated EBITDA came to R$543.0 million in 2014, rising by 14.0% in relation to R$476.5 million in 2013. Consolidated EBITDA margin stood at 24%. EBITDA in the Telecom segment totaled R$450.2 million in 2014, 12.5% up on 2013. EBITDA margin stood at 30%, a 2 p.p. increase against 2013. This performance was led by a revenue increase and the Company’s improved operational efficiency, both which impacted mainly the interconnection, means of connection, third-party services and ADA accounts.
EBITDA from the Integrated ICT Solutions and BPO segment rose by 22.8% to R$92.7 million in 2014. EBITDA margin, in turn, decreased from 13%
in 2013 to 12% in 2014, impacted by expenses on integrating Asyst.
EBITDA vs. EBITDA Margin
(in R$ million and %)
EBITDA by Business Segment
(in R$ million)
Net Financial Income
(Expense)
In 2014, we recorded a net financial expense of R$127.0 million, up 45.8% year-over-year. The increase was due to a higher average debt, driven by the Company’s investments, coupled with a higher average debt rate, reflecting the increase in the CDI (Certificado de Depósito Interfinanceiro, or Interbank Deposit Certificate) rate and IPCA (Índice de Preços ao Consumidor Amplo, or Broad Consumer Price Index) in 2014
(about R$24 million).
Net Income
Net income at the close of 2014 amounted to R$141.8 million, 2.9% up on R$137.8 million in 2013. The 2014 net income was affected positively by a non-recurring event, with an impact of R$21.0 million from deferred taxes on tax credits. Without that effect, net income would have come to R$120.8 million, with 5.4% margin. The drop in relation to 2013, despite improved operating performance as measured by EBITDA,
is explained by higher depreciation expenses and the loans connected with the investments required to fulfill the Company’s expansion plan in 2014.
Gross and Net Debt
(in R$ million)
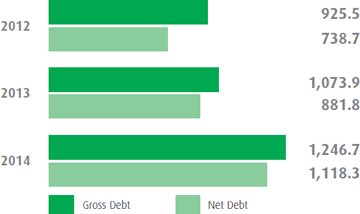
Debt
Gross and net debt totaled R$1,246.7 million and R$1,118.3 million respectively at the close of 2014, versus R$1,073.9 million and R$881.8 million in 2013. The R$172.8 million increase in gross debt is explained by the funds raised for part of the investments in the year–including the Asyst acquisition–, which amounted to R$ 572 million. Our financial leverage ratio remains at a level considered appropriate by our executives and controlling shareholders. Our debt increase was related to investments that will allow us to retain clients and gain a competitive edge to expand our business. Our debt has a long-term profile, with only 17% maturing in the short term (vs. 14% in 2013).
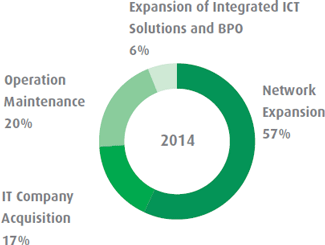
CAPEX
In 2014, we invested R$572 million to expand our business, acquire Asyst and strengthen our competitive positioning in coming years. Of this amount, 57% was invested to expand networks, with an ensuing growth in data, voice and
TV services, and 6% to expand the Integrated ICT Solutions and BPO segment organically. In turn, 20% went to operation maintenance and service quality, and the remaining 17% to the Asyst acquisition, in the IT business.
In 2014, we signed with Google (U.S.), Angola Cable (Angola) and Antel (Uruguay) an agreement to lay an submarine fiber-optic cable between the cities of Santos, Brazil, and Boca Raton, U.S. At an auction held by ANATEL, we also acquired Lot 5 of the 700MHz frequency range (4G), which covers the 87 cities and towns already served by the Company in the states of Minas Gerais, São Paulo, Goiás and Mato Grosso do Sul.
VAS
GRI G4 EC1 – Material issue: Aspect: Economic Performance
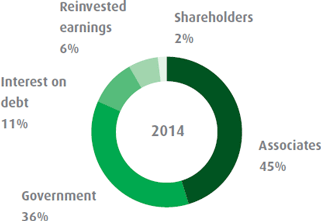
The Value-Added Statement (VAS) shows the economic value
we generate and distribute, including revenue, operating costs, staff compensation, donations and other community investments, retained earnings, and payments to capital providers and governments. We generated R$1,437 million, R$1,502 million and R$1,782 million respectively in 2012, 2013 and 2014. Most of this amount went to associates and
the government. The amount distributed to shareholders has remained practically stable over the last three years.
Value-Added Statement - VAS
(in R$ million)
| VAS |
2012 |
2013 |
2014 |
| 1. REVENUE |
2,336.0 |
2,451.4 |
2,855.2 |
| SALES OF MERCHANDISE. PRODUCTS AND SERVICES |
2,336.0 |
2,451.4 |
2,855.2 |
| 2. INPUTS ACQUIRED FROM THIRD PARTIES (INCLUDING ICMS and IPI TAXES) |
(762.7) |
(788.9) |
(869.6) |
| COST OF PRODUCTS. MERCHANDISE AND SERVICES SOLD |
(489.0) |
(498.7) |
(548.5) |
| MATERIALS. ENERGY. THIRD-PARTY AND OTHER SERVICES |
(273.7) |
(290.2) |
(321.1) |
| LOSS/RECOVERY OF ASSET VALUES |
- |
- |
- |
| 3. GROSS VALUE ADDED |
1,573.3 |
1,662.5 |
1,985.5 |
| 4. RETENTIONS |
(161.6) |
(186.8) |
(237.5) |
| DEPRECIATION. AMORTIZATION AND DEPLETION |
(161.6) |
(186.8) |
(237.5) |
| 5. NET ADDED VALUE |
1,411.7 |
1,475.7 |
1,748.0 |
| 6. VALUE ADDED RECEIVED BY TRANSFER |
25.1 |
26.4 |
33.9 |
| EQUITY PICKUP |
- |
- |
- |
| FINANCIAL INCOME |
25.1 |
26.4 |
33.9 |
| 7. TOTAL VALUE ADDED TO BE DISTRIBUTED |
1,436.8 |
1,502.1 |
1,782.0 |
| 8. VALUE ADDED DISTRIBUTION * |
1,436.8 |
1,502.1 |
1,782.0 |
| PERSONNEL AND PAYROLL CHARGES |
572.8 |
608.5 |
800.2 |
| TAXES. FEES AND CONTRIBUTIONS |
583.9 |
607.8 |
640.0 |
| INTEREST AND LEASE |
139.1 |
148.0 |
200.0 |
| DIVIDENDS AND INTEREST ON EQUITY |
34.4 |
32.8 |
33.8 |
| RETAINED EARNINGS/LOSSES IN THE YEAR |
106.6 |
105.0 |
108.1 |